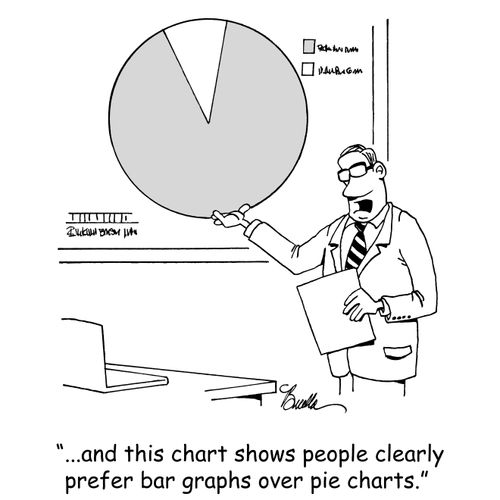
"...and this chart shows people clearly prefer bar graphs to pie charts."
Looking for a gift for your data visualization buff? Our collection offers clever and colorful products that blend humor with love for data. Whether they’re a chart lover, infographic fanatic, or simply fascinated by data storytelling, these gifts will resonate with their passion. From amusing mugs to stylish prints, each item celebrates their unique interest in an engaging way. Surprise them with a thoughtful token that recognizes their analytical zest and creative flair.
"...and this chart shows people clearly prefer bar graphs to pie charts."
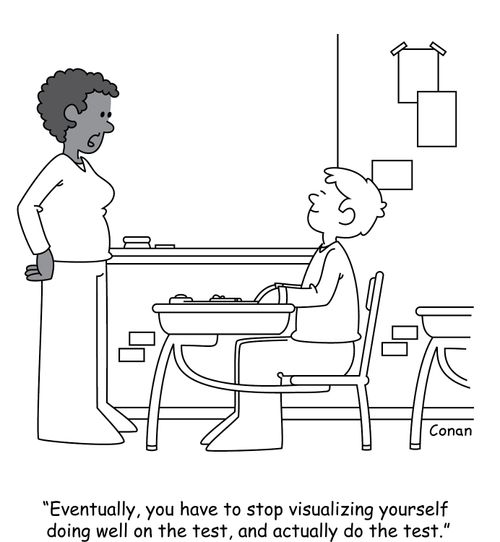
"Eventually, you have to stop visualizing yourself doing well on the test, and actually do the test."
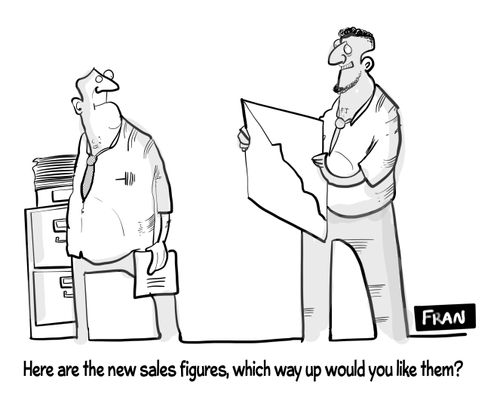
"Here are the new sales figures, which way up would you like them?"
"Perhaps this slide whistle can better illustrate what this graph is telling us."
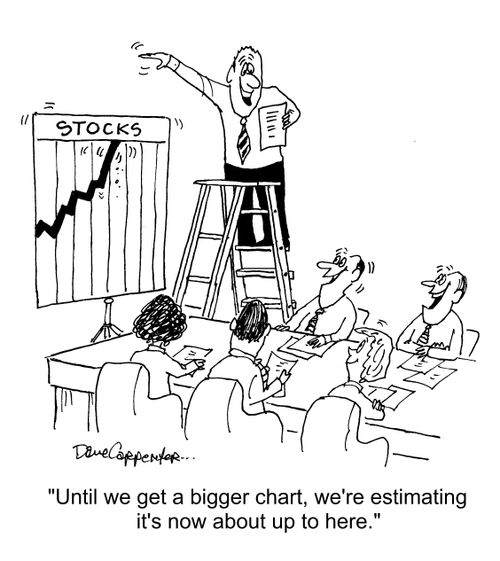
"Until we get a bigger chart, we're estimating it's now about up to here."
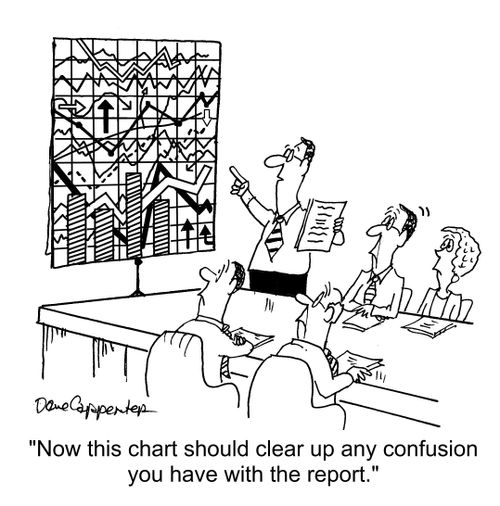
"Now this chart should clear up any confusion you have with the report."
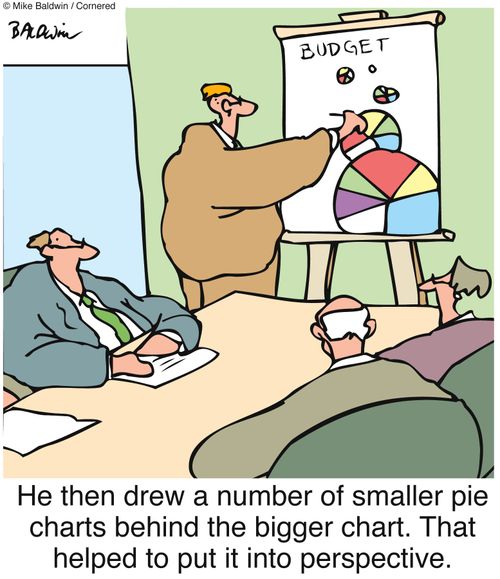
He then drew a number of smaller pie charts behind the bigger chart. That helped to put it into perspective.
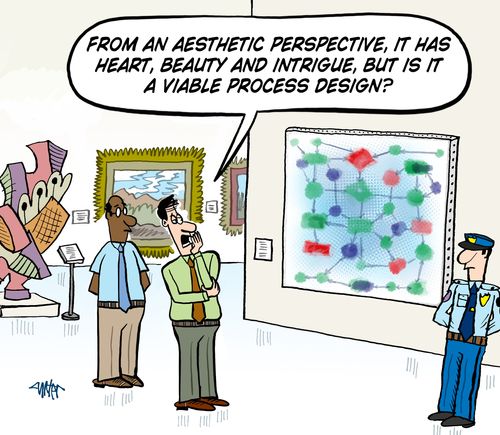
'From an aesthetic perspective, it has heart, beauty and intrigue, but is it a viable process design?'
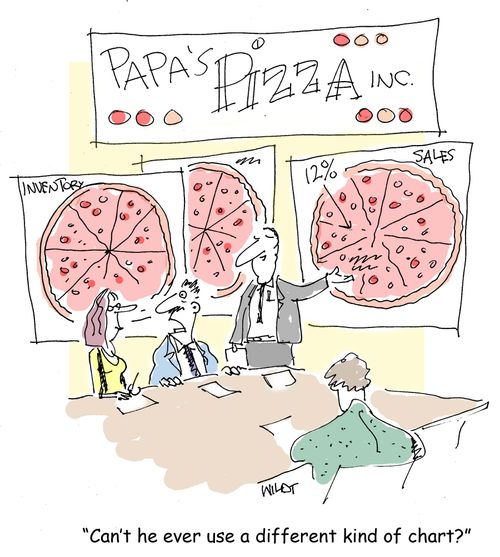
'Can't he ever use a different kind of chart?'
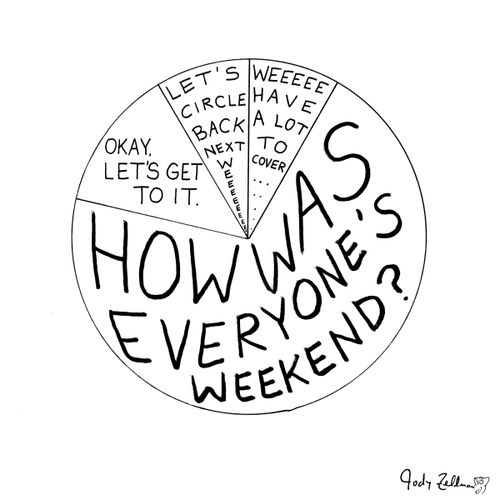
We Have A Lot To Cover.....
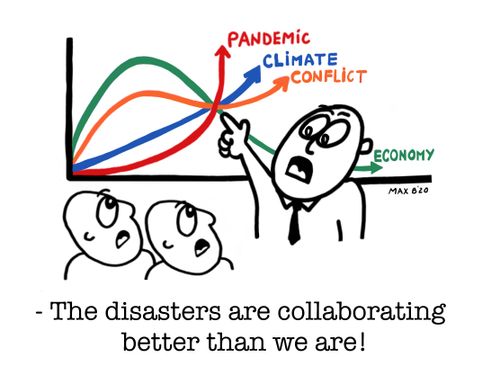
"The disasters are collaborating better than we are!"
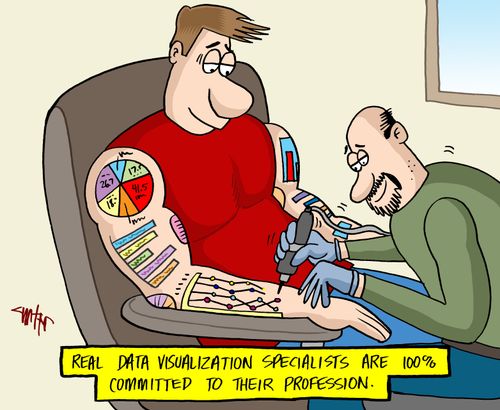
Real data visualization specialists are 100% committed to their profession.
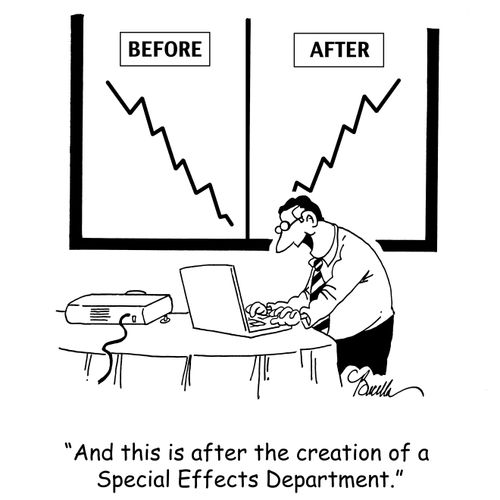
'And this is after the creation of a Special Effects Department.'
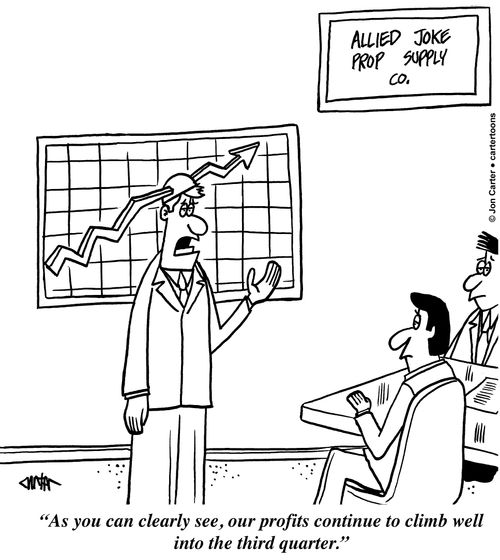
'As you can clearly see, our profits continue to climb well into the third quarter.'
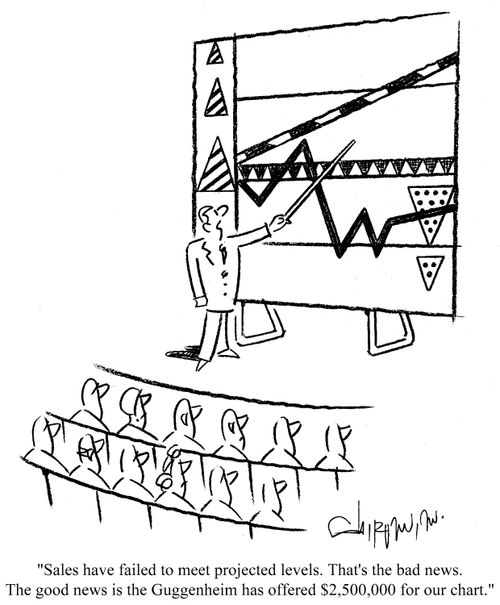
'...The good news is the Guggenheim has offered $2,500,000 for our chart.'
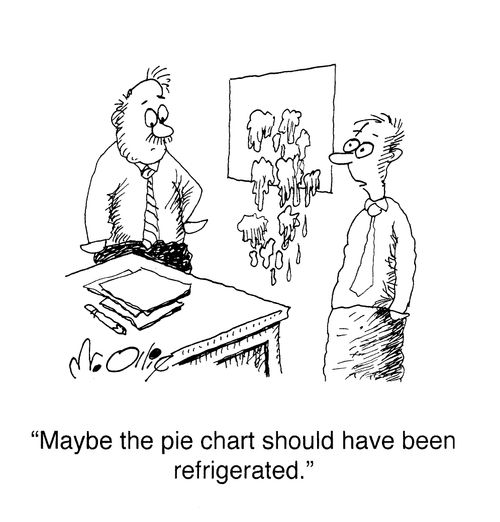
"Maybe the pie chart should have been refrigerated."
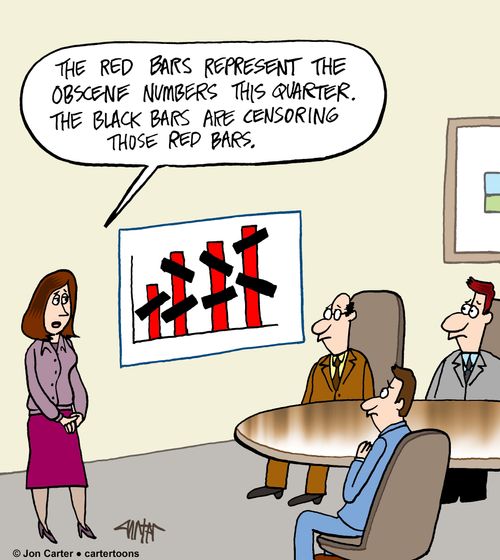
"The red bars represent the obscene numbers this quarter. The black bars are censoring those red bars."
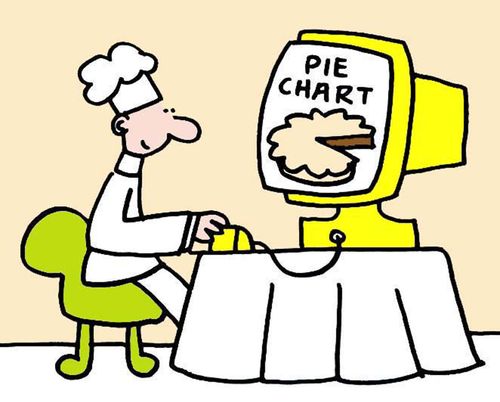
"Pie chart"
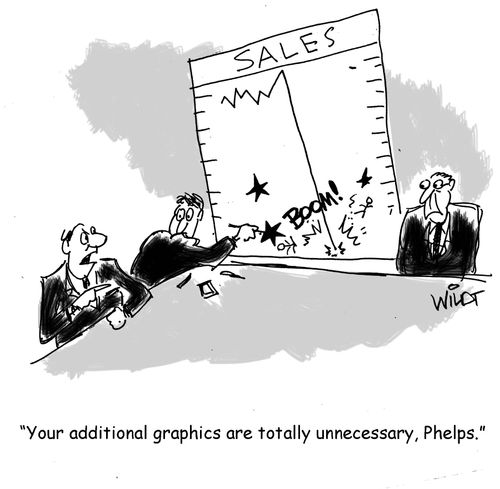
"You additional graphics are totally unnecessary, Phelps."
Sales and Diversity
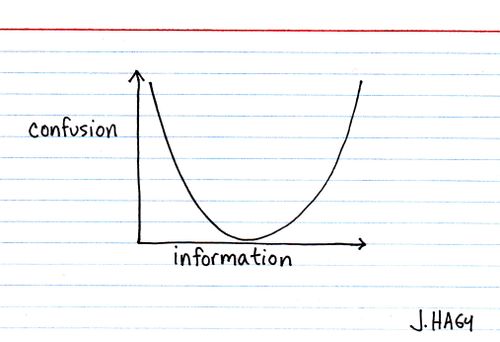
Information vs. confusion
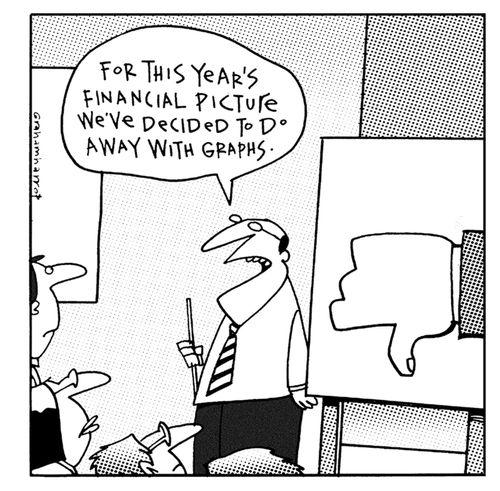
"For this year's financial picture, we've done away with graphs."
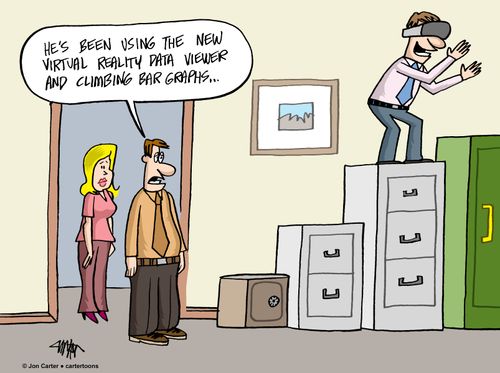
"He's been using the new virtual reality data viewer and climbing bar graphs..."
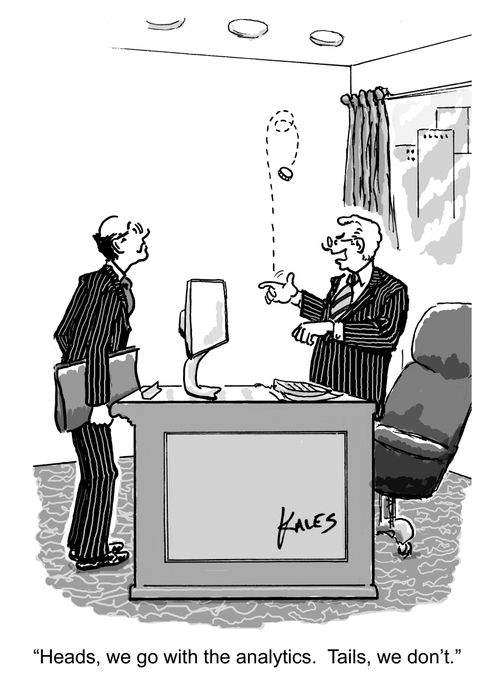
"Heads, we go with the analytics. Tails, we don't."
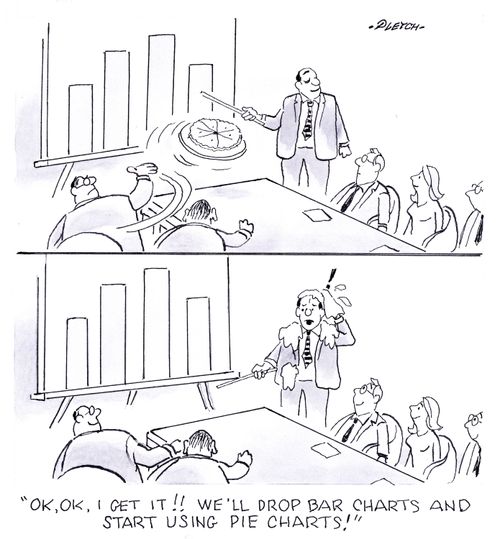
'OK, OK, I get it!! We'll drop bar charts and start using pie charts!'
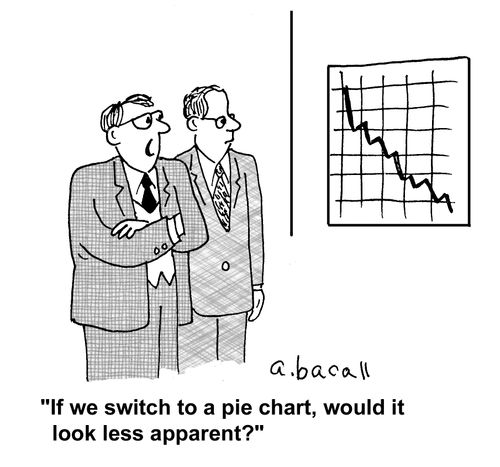
'If we switch to a pie chart, would it look less apparent?'
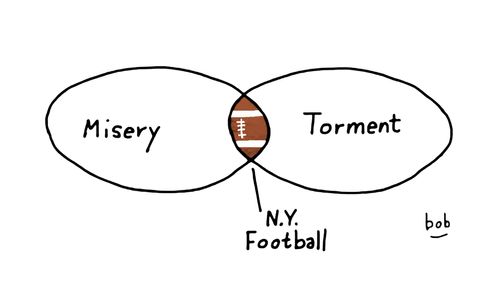
"Misery, torment, N.Y. football"
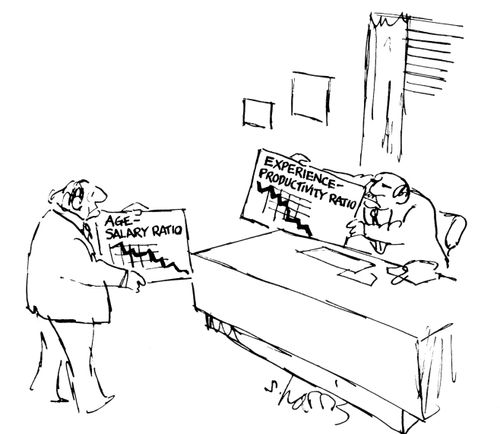
Age-salary ratio
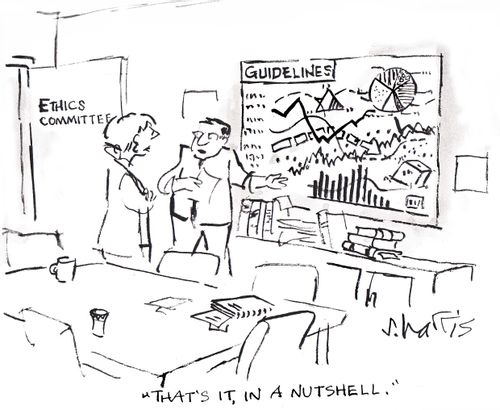
'That's it, in a nutshell.'
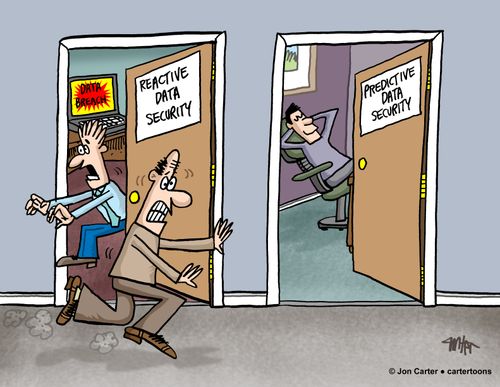
Data security officers run frantically out of reactive data security room, while another data officer relaxes in the predictive data security room.
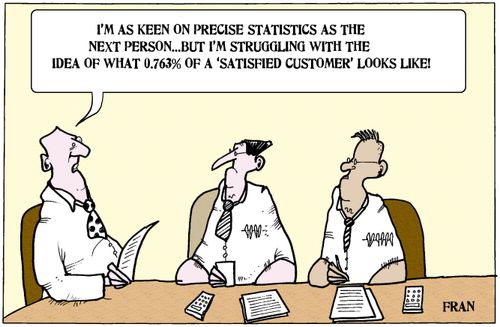
'I'm keen on precise statistics as the next person...'
'Now close your eyes and visualize our upcoming softball game against the elm street zen center and kicking their sorry behinds.'
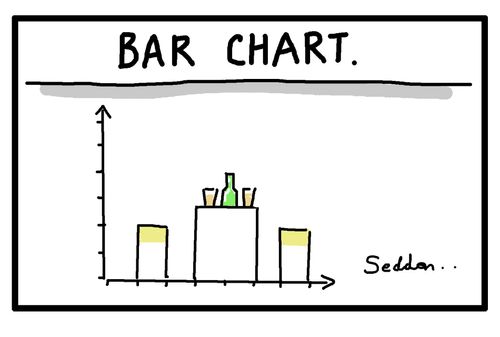
Bar chart
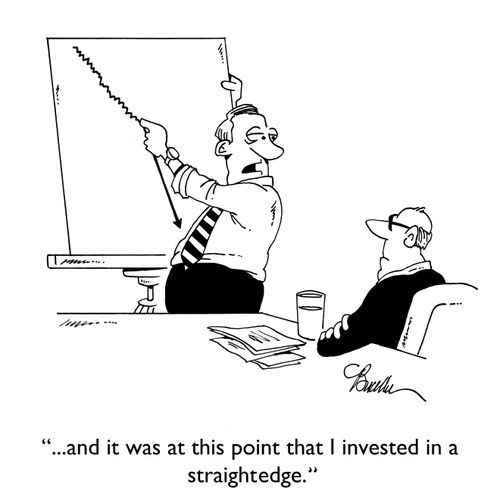
"...and it was at this point that I invested in a straightedge."
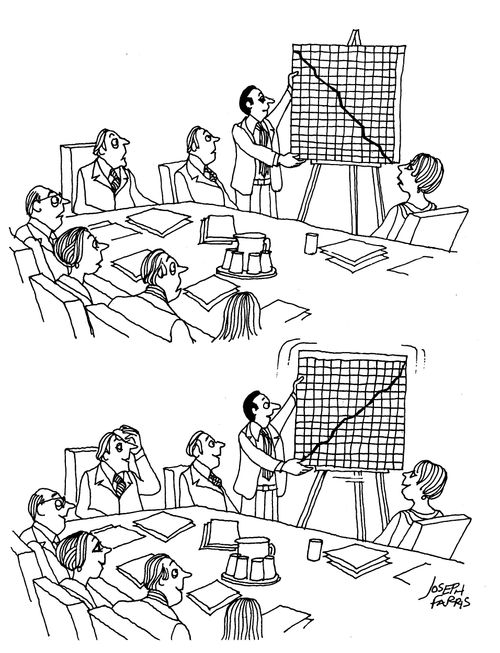
Turning a business graph around to get a positive reading.
Explore our collection of mugs perfect for data visualization buffs, combining humor and charts in every sip.
Discover cozy pillows featuring data-inspired designs—ideal for the data enthusiast who loves a witty touch in their living space.
Browse our selection of artistic prints that celebrate the art of data visualization, adding inspiration and humor to any room.
Check out our range of fun and stylish t-shirts designed for data lovers. Perfect for showcasing their passion with a clever twist.